
← Home
Employee Attrition Dashboard & Analytics
Role
Data Analyst
Keywords
Year
2025

Table of Contents
← HomeEmployee Attrition Dashboard & AnalyticsTable of ContentsAboutProblemReport ObjectivesAnalysis ProcessInsightsSummaryRecommendationsWhat I’ve LearnedOther ProjectsLet’s Work Together
About
Live Demo
Slides
Project Review
Why are employees at corporation ABC leaving? What can leaders do to decrease attrition rate?
My analysis (as a part of the NextGen Analytics competition) provides the solutions through a clear 5-step analysis process.
The final outcome includes:
- a Power BI dashboard with the most crucial metrics, advanced features to improve UI/UX and analysis quality (such as tabs, parameters, advanced measures and visualizations, Machine Learning)
- a set of slides
- and a video presentation.
Tech Stack
- Power BI
- DAX
- Python
- Canva
Hi! The detailed blog article for this project is not yet completed. In the mean time, please check out this quick summary and the resources above to know about the context of the project.
Problem
Corporation ABC has been struggling with high attrition rate among its employees for the past few years. As a Data Analyst at the corporation, my mission is to investigate the root cause of the problem and collaborate with other stakeholders to deploy a solution.
Report Objectives

Analysis Process
Finding the root cause of any issue is never easy. There are million factors that can affect said problem. Hence, I devised a 5-step process to make sure I tackle the most important factors first and therefore save everyone’s time.

Insights
After Exploratory Data Analysis, I plotted out graphs that I think can answer certain hypotheses about the root cause of employee attrition.
Ultimately, I concluded with 3 main causes to employee attrition:
- Convenience
- Work Allocation
- Recognition
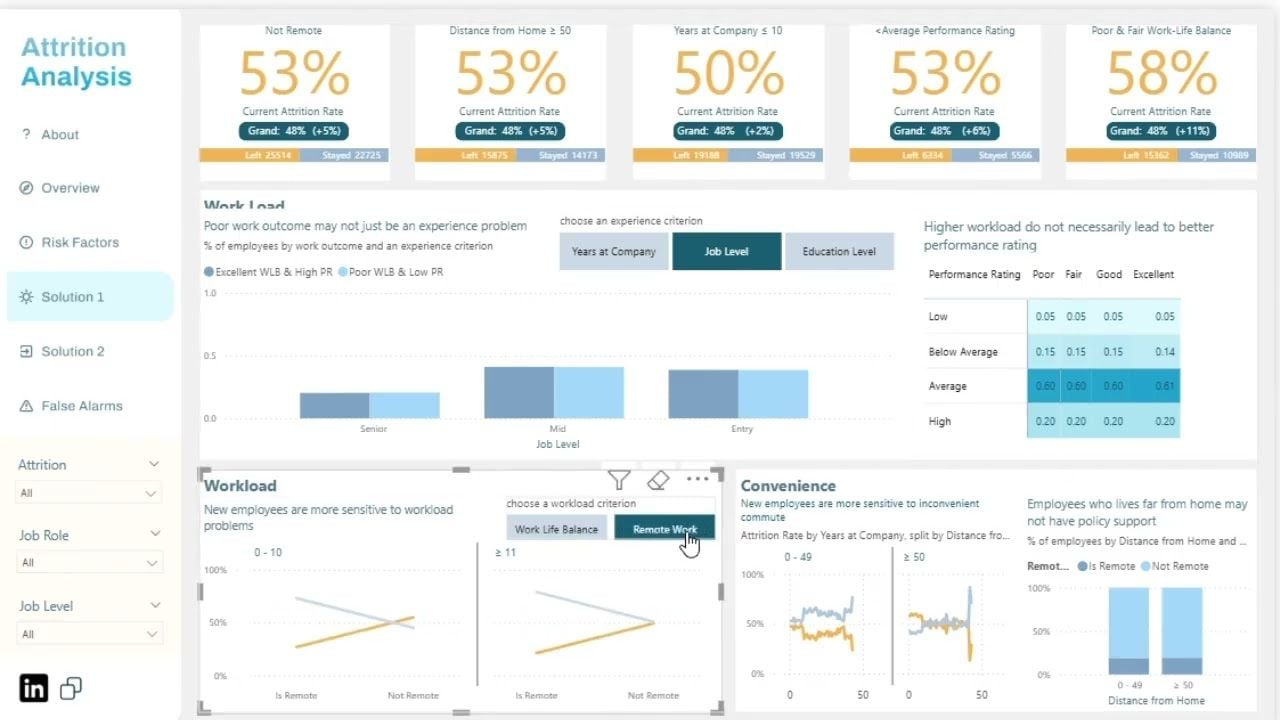
Each cause is illustrated in the following graph, which shows how much time it needs to change each said cause. Of course, the speed denoted is only a quick assumption for reference, the actual speed to adopt changes may vary.

The image below describe one of such insights. Read the slides above to discover more insights.

Summary
To sum up, I discovered three main factors that may lead to employee attrition:
- Convenience
- Work Allocation
- Recognition

Recommendations
Based on each factor, I created a table and propose an action plan for each stakeholder level.
Of course, this is just an initial proposal based on my insights and knowledge. Upon more discussion with other stakeholders, we can refine this plan to make it more detailed and suitable to one’s needs.


What I’ve Learned
This is one of the most complex analysis projects that I’ve done, not because it uses complex Power BI techniques, but because I’ve used a more structured process to problem-solving.
In this project, I did not start slamming the most fancy Data Science mechanisms right away, but I did thorough research in how to conduct a proper analysis first.
And I think it payed off very well - the initial problem was discrete, with so many variables that accompanied the dataset. The final output reduces the problem to three main factors, which is accompanied with an action plan that the corporation can refine right away.

That’s concludes the project for now. Happy Learning!
Other Projects
Gallery view

Employee Attrition Dashboard & Analytics
Dashboard that analyzes employee attrition root causes by leveraging a detailed analysis process, advanced Power BI features, and Machine Learning for Churn Prediction.
Data Analyst
Power BI
Python
People Analytics
Competition
Analytics Dashboard

SQL Databricks Data Warehouse
A Data Warehouse in Databricks using a Medallion architecture (bronze-silver-gold), accompanied by data tests in dbt, which performs automated data quality checks for prompt error handling.
Data Engineer
Databricks
SQL
dbt

Automated Spreadsheet Dashboards
Automate Google Sheets to create dashboards that track teams’ sales leads, Marketing campaigns, sales overview and more.
Data Analyst
Google Sheets
Analytics Dashboard

Customer Growth using AI (Segmentation, Churn Prediction, CLV Prediction)
Perform RFM customer segmentation and model churn, survival, and customer lifetime value (CLV) using transactional data to identify high-priority customer groups.
Data Scientist
Machine Learning
Statistical Modelling
Python
Streamlit
Flask

TPC-H Data Warehouse Pipeline
Modern ELT pipeline using Airflow, dbt, and Snowflake built on the TPC-H benchmark dataset (SF1).
Data Engineer
Airflow
dbt
Docker
uv
Python
astronomer
Snowflake

RAG Chatbot for Flower Shop Recommendations
A Naive RAG chatbot that recommends flower shop products using semantic search on embedded product data. It features a Streamlit interface, a Scrapy-based data scraper; a backend including MongoDB vector search for retrieval, an LLM via OpenRouter; and a Flask API that connects the frontend with the backend.
AI Engineer
RAG
MongoDB
Vector search
Flask
API
Python

Sequential Recommender System for Video Recommendations
Data Scientist
AI Engineer
Recommender Systems
Machine Learning
pytorch
API
FastAPI
 Made with Bullet